 Help Center
What is the Analytics Hub™?
The Analytics Hub™ is a self-service, on-demand portal that provides key administrators deep visibility into their institution's academic integrity landscape. It provides essential data and tools to understand Honorlock's impact, track proctoring trends, and inform policies. It equips administrators to understand Honorlock's impact on academic integrity and discover proctoring trends within their institution or organization. It offers robust reporting and insights into proctoring usage, common flags and violations, trends, and more.
Why Was It Created?
Before the Analytics Hub™, key administrators lacked direct access to comprehensive integrity data and relied heavily on Customer Success Managers to pull reports for them. This created bottlenecks and limited their ability to react quickly to trends or manage their integrity landscape effectively. The Analytics Hub™ solves this by providing powerful, on-demand analytics and actionable insights anytime, anywhere.
Key Benefits
With the Analytics Hub™, key administrators can:
-
Understand Honorlock's Impact: See how Honorlock supports test-taker success and how security features protect exam content.
-
Monitor Utilization: Understand proctoring utilization across the entire institution.
-
Inform Policy & Strategy: Develop impactful policies and procedures to improve integrity and drive adoption.
How do I access the Analytics Hub™?
-
Open your Analytics Hub™ portal.
-
Follow the prompts to reset your password.
-
Once new login credentials are created, you can log in.
If you have any questions or difficulties accessing the hub, please contact your designated Customer Success Manager.
How does it work once logged in?
Once logged in, you will have access to your institution's data. You can filter the start and end date according to the data you want to review. The Analytics options are available on the left side of the screen, providing access to:
|
|
|

Reports can typically be exported into .CSV and/or PDF formats for further analysis.
What core reports & dashboards are available?
-
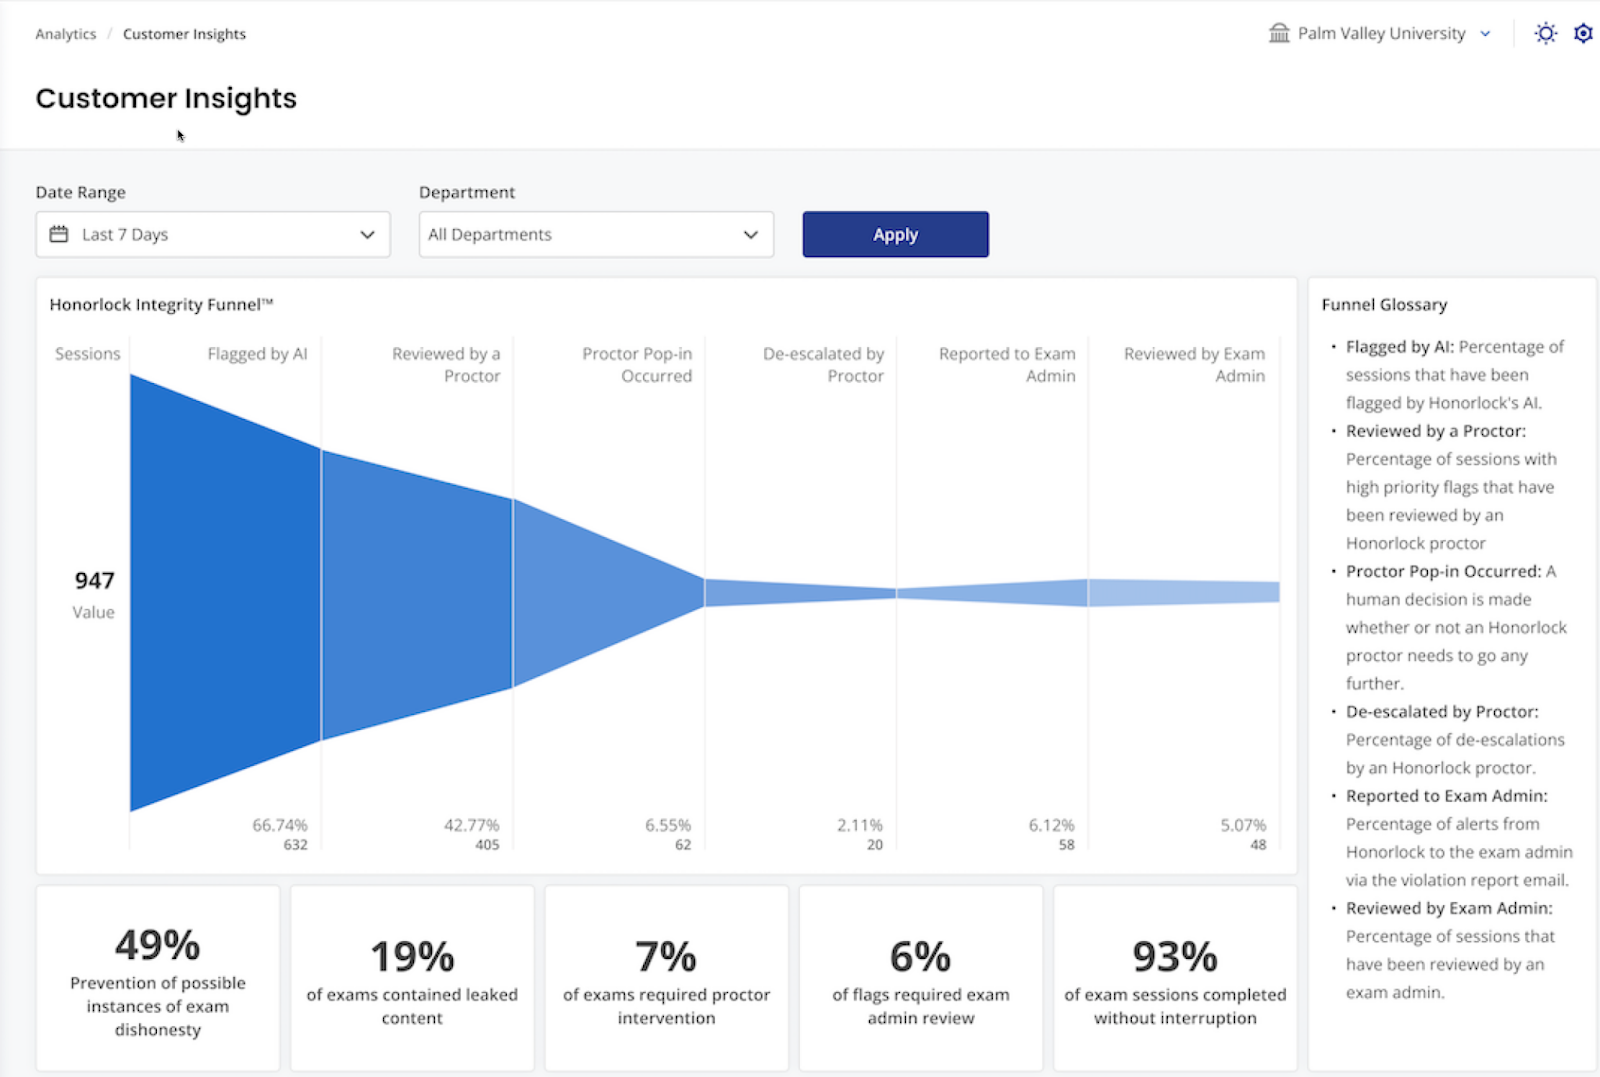
Executive Summary: A snapshot of your institution's unique Honorlock Integrity Funnel™, showing integrity averages and the full lifecycle of AI-generated flags, proctor reviews, de-escalations, violations, and faculty reviews.
-
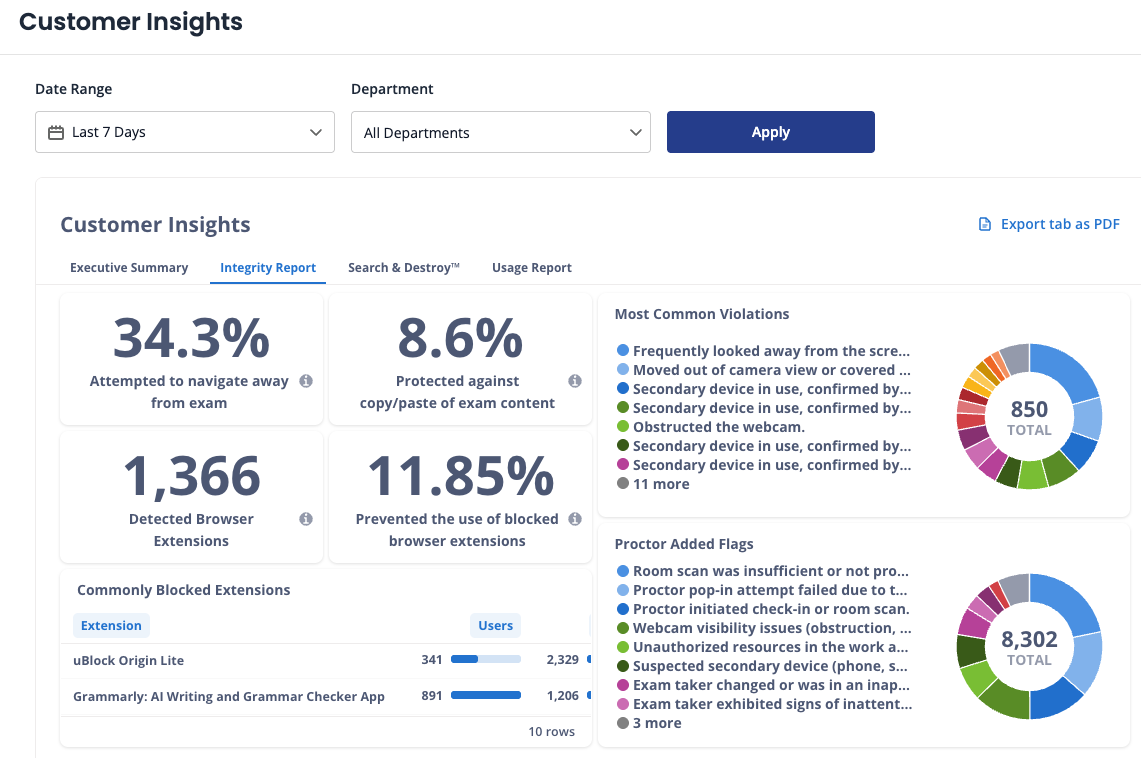
Integrity Report: Understand how Honorlock's features, like Extension Detection, Copy/Paste Detection, and Search & Destroy™, safeguard assessments.
-
Highlights include common violations (e.g., Secondary Device, Unauthorized Materials), extension detection trends (e.g., ChatGPT), and BrowserGuard™/Copy/Paste blocking rates.
-
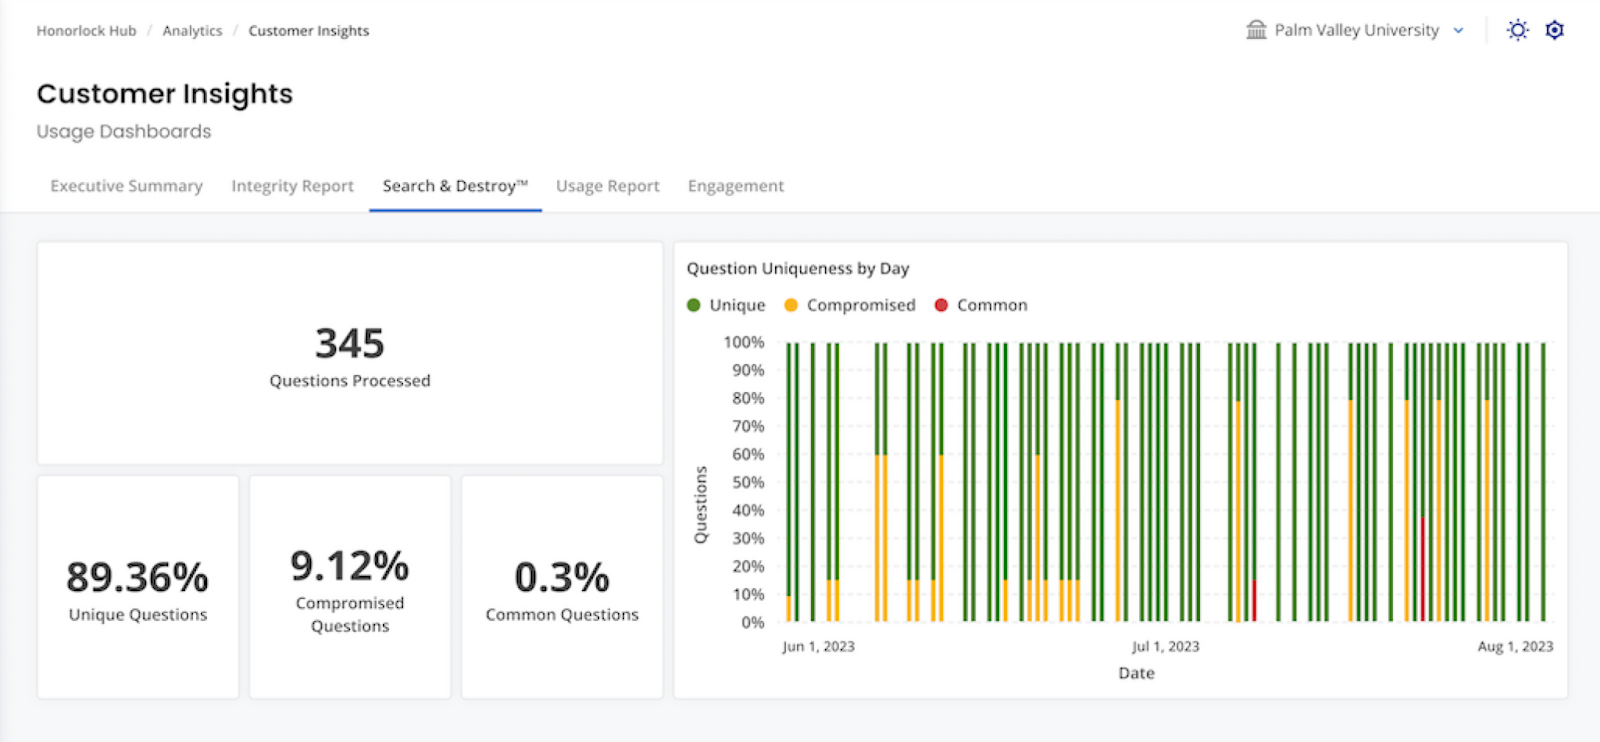
Search & Destroy™ Reporting: Provides a breakdown of assessment item health (Unique, Compromised, Common questions) and trends in question uniqueness. Administrators can leverage this data to facilitate the development of better and more unique assessments.
-
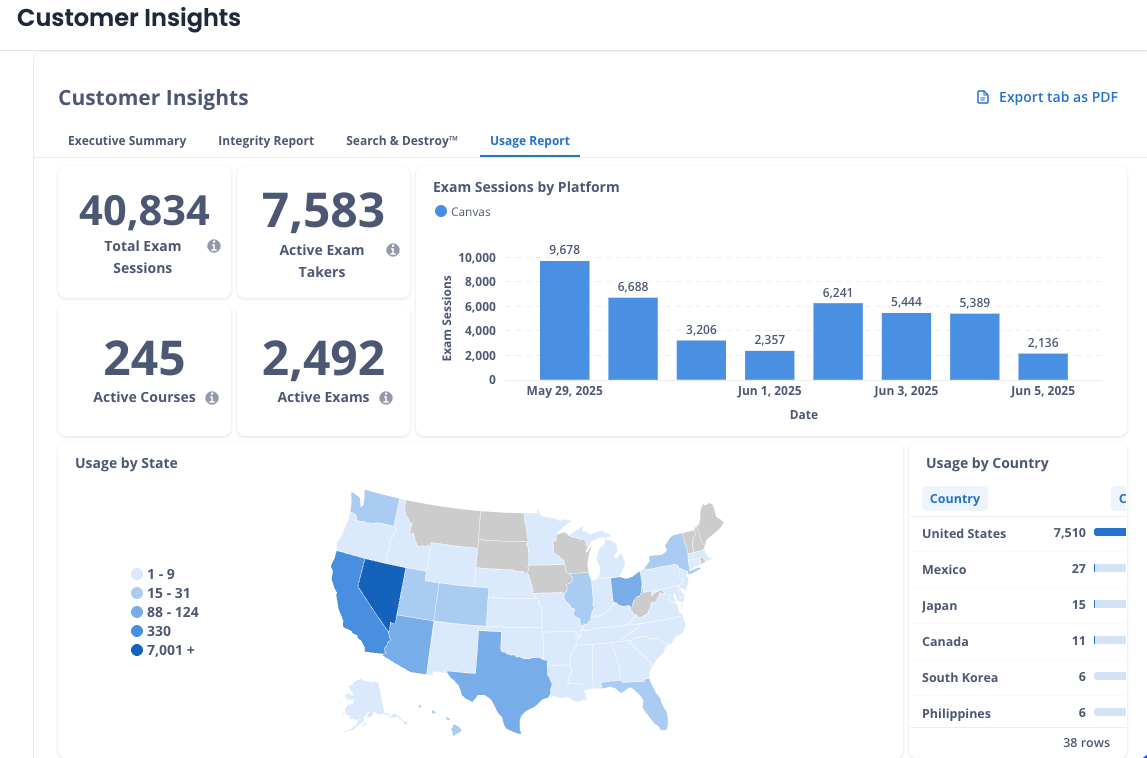
Usage Report: Real-time usage data including sessions, active courses, active exams, and exam takers. Identifies usage by exam type and platform. This report empowers key admins to proactively manage and monitor the under- or over-utilization of proctoring licenses.

-
-
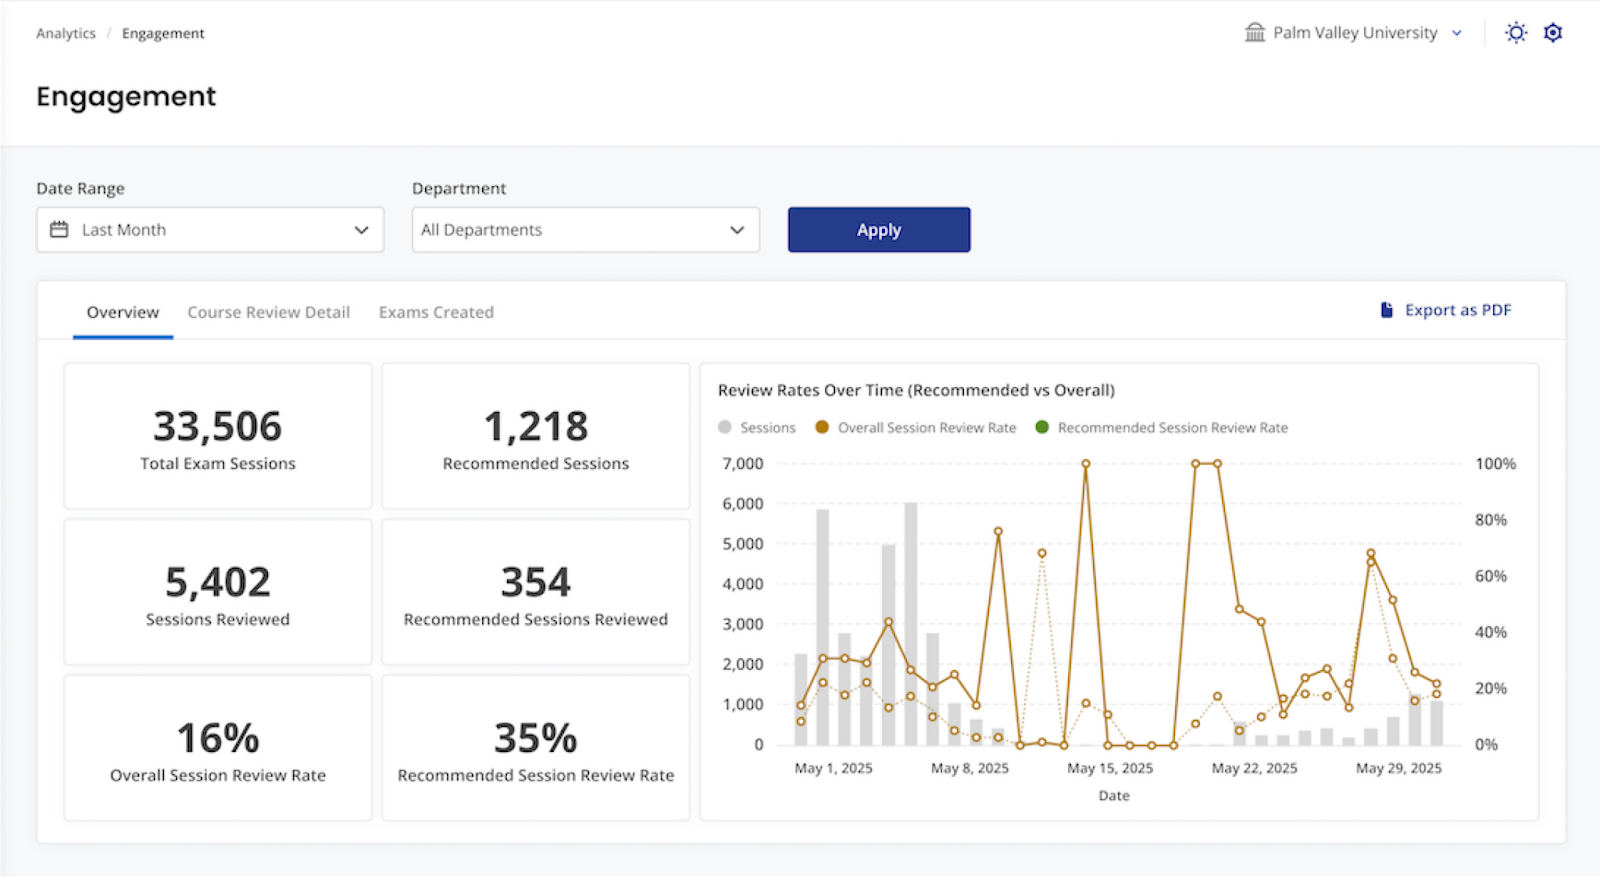
Engagement Dashboard: Empowers administrators to better monitor usage across courses and departments by providing insight into:
-
Recommended Review Rate compared to Overall Review Rate.
-
A course-by-course and user-by-user breakdown of who is reviewing sessions.
-
A report of all Honorlock-enabled exams for a given period.
-
A report to understand adoption, including instructor/exam administrator data, identifying active/new users, and tracking exams created by user.
-
This dashboard is crucial for fostering a culture of integrity. Proctor identification of suspicious activity is only effective if faculty follow through. Understanding faculty engagement allows administrators to reinforce processes, encourage student feedback, and prevent students from feeling emboldened if they know proctoring results aren't being reviewed or utilized.
-
-
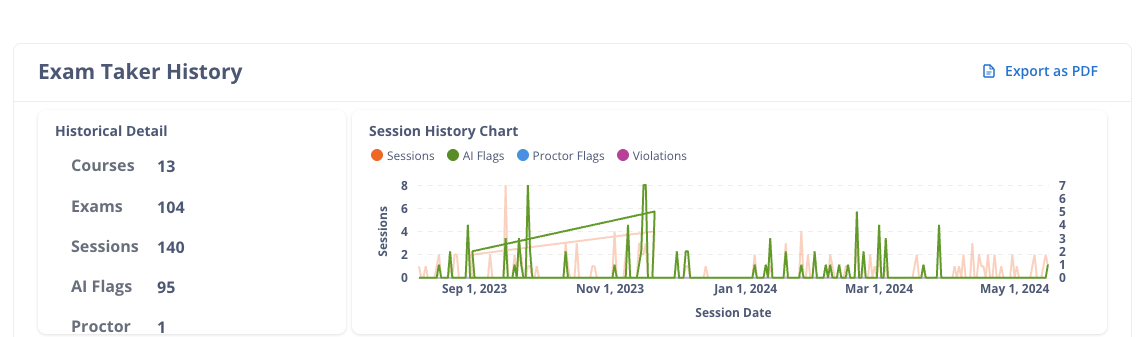
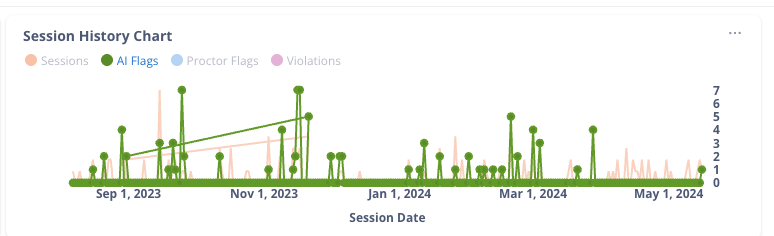
Exam Taker Explorer: View a test taker's proctored exam history, including flags, pop-ins, and proctor-added violations, useful for academic dishonesty investigations.
-
Sensitive Content Dashboard: Real-time visibility into reported sensitive content. Key sections include:
-
Total Reported Instances
-
Sensitive Content Reports by Type
-
Sensitive Content Reports by Day
-
Detailed listing of all Sensitive Content Reports for the given period.
-
Provides vital insights for monitoring student safety, ensuring compliance with guidelines, and tracking inappropriate behavior towards proctors or staff.

- Integrity Health Dashboard: Provides an overview of how integrity health is trending and allows administrators to drill down to better understand test taker trends. It will provide insight into:
- Violation Rate by Course: Compare test taker and session-based violation rates across all courses to easily identify outliers or areas of opportunity that need immediate attention.
- Violation Trends: Determine if exam administrators are addressing exam integrity. Violation trends uncover whether integrity issues are being resolved or if they are persisting and escalating.
- Exam Taker Violation Information: Understand which test takers have multiple violations and in which courses these violations are occurring.


How can I leverage these reports together?
-
This Analytics in Action Quick Tip helps you understand the story the data tells you and offers suggestions for supporting faculty and test administrators.